Table of Contents:
- Introduction to Event Analytics
- Analytics Dashboard Overview
- People
- Sessions
- Gamification
- Banner Ads
- Networking
- Live Stream
- Video
1. Introduction to Event Analytics
The Experience Manager offers you access to your event reporting directly from the Analytics area. Here you can monitor adoption rates and trends that will help you to establish your promotional strategy or calculate your return on investment.
Analytics Areas:
Using the Menu located at the top of the page you can access an overview by Dashboard as well as dedicated areas to view trends related to People, Gamification, Banners, Networking, Live Stream and Video. Each option will provide you with adoption or engagement rates, along with insights into what aspects of those features were most successful.
Date Range for Analytics:
To adjust the timeframe that is included in the report, simply select Edit Date Range at the top of the page to select which dates you would like to include.The default setting for the Event Date Range is to display data starting three days prior to your Event Dates and extending three days after, as specified in the Event Details section.

Please be aware that all exported reports will display the time zone in UTC and not in the event time zone.
If you are looking to efficiently convert time zones in Excel, we recommend checking out our article 'Converting Time Zones in Excel.' This resource will help you master the process of converting UTC time to the event time zone seamlessly.
2. Analytics Dashboard Overview
The Analytics Dashboard provides event organizers with a comprehensive overview of user engagement and interactions within their event platform. This tool helps event organizers track and understand how participants are interacting with various elements, allowing for informed decisions to improve attendee experience and event success.
Click the Export button in the upper right corner of the Analytics Dashboard to download the current view as a PDF. This document will include key metrics and insights, making it easy to share with team members and review performance.
Overview People Data
- Logged In Rate: Logged in rate is calculated by dividing the number of users who logged into the event by the number of people in the attendees group.
- Total People: The number of individuals listed in the people library.
- People Who Logged In: The number of users who successfully logged into the Event App.
- Unique Visitors: This metric represents the count of individual devices that accessed the platform. For instance, if an individual logs into the Event App using both a mobile phone and a tablet, it will be recorded as two separate unique visitors.
- Total Pageviews: The overall number of pageviews across the Event App.

Overview Device Usage
- Desktop: This metric indicates the percentage of users who accessed the event platform using a desktop computer.
-
Mobile: This metric reflects the percentage of users who engaged with the platform via mobile devices.

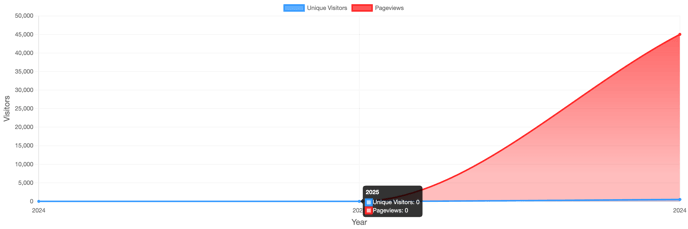
This section provides valuable insights into the usage trends of the Event App over time, enabling organizers to pinpoint periods of peak engagement. Key metrics analyzed include the number of Unique Visitors and the total number of page views.
Top Pages for Sessions, Sections and Companies
This section highlights the most frequently accessed pages and sessions that attendees have interacted with. Users can utilize the dropdown menu to select between Companies, Sections, and Sessions. The key metrics provided are as follows:
-
Pageviews: The total number of views recorded for each session, section, or company profile.
-
Unique Visitors: The count of distinct devices that accessed this page.

The Top Sessions section provides an overview of the most popular sessions within your event, allowing you to see which sessions garnered the most engagement. It includes data from users accessing the event through both the web and mobile applications, in addition to session check-ins and check-outs scanned via the Onsite App.
Key metrics available include:
- Session Name: The title of the session or activity.
- Pageviews: The total number of views for each session, indicating how many times attendees accessed it.
- Unique Visitors: The number of distinct attendees who participated in or viewed the session.
In addition to individual session metrics, the dashboard also provides cumulative data for all sessions:
- Total Sessions: The total number of sessions held during the event.
- Session Pageviews: The overall number of views across all sessions.
- Total Unique Visitors: The total number of unique attendees who engaged with any session.

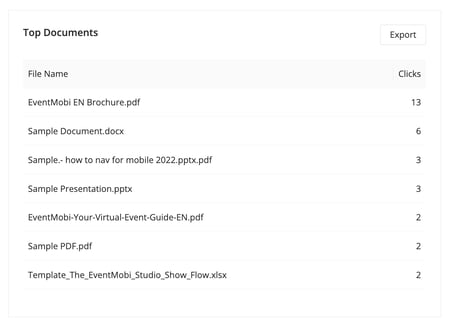
A compilation of the most frequently downloaded documents or resources, along with the corresponding number of downloads. This information assists organizers in identifying which materials are most appealing to attendees.
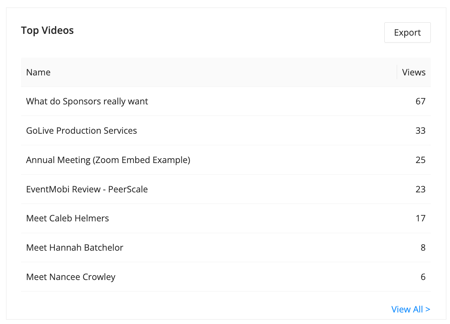
Top Videos
Video Titles and View Counts: This section provides an overview of the most popular videos, including the total number of views for each.
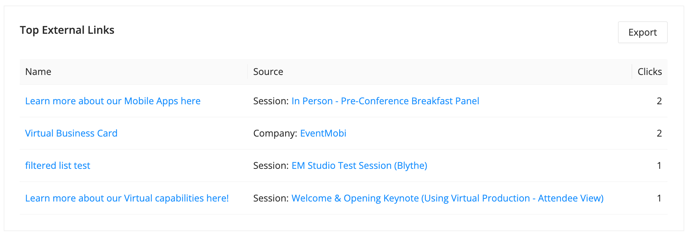
Top External Links
This section presents a detailed list of external links that users have clicked on, including the originating source (such as a specific session or company) and the total number of clicks for each link. This valuable data enables organizers to gauge user interest in external resources.
3. People
Event Attendance Report
The People tab of the Analytics area will offer you an Event Attendance Report that will outline which attendees have logged into your Event App and/or checked into and out of your event.

The WebApp report will outline the First Name, Last Name, Email, Company and Group of each person that logged into the Event App.

The Onsite report will outline who has been checked in or out of your event using the Onsite App. This report will include a list with the First Name, Last Name, Email, Groups, Date & Time along with the Type (Check In or Check Out). 

A Filter icon will also be made available to the top right-hand side to make it easy to isolate a specific group of People within the report. Each column will also include Sort and Search options to make it easier to review your data. To download the results of a report to Excel, simply click on the Export option found to the top right-hand side.
Page Views
In addition to outlining who attended your event, the People analytics will help to show you who interacted with specific sections or content within the Event App. From the Page Views area of the People tab, you will find the option for Filter or URL that will help you to define which section or page within the Event App you are looking to review the number of page views for.
The Filter option will offer a drop down menu where you can select data from a specific feature type, section or page - for example, selecting the Companies option and then make a further selection to determine if the page views should display the Sponsors section in the Event App, or a specific Company profile.

The URL allows you to quickly identify the number of page views to a specific page of the Event App that you would like to reference. Simply copy and paste the URL of the page that you would like to review into the field that is provided.

Below your Page View chart, you will also see a breakdown of which specific attendees visited the section or page that you are reviewing - helping you to measure success and engagement levels at your virtual event.
.png?width=675&height=392&name=Screen%20Shot%202021-01-28%20at%2012.10.06%20PM%20(1).png)
4. Sessions
The Sessions section provides a detailed view of attendee engagement for both individual sessions and all sessions combined. When viewing the overall session data, organizers can monitor key metrics across all sessions. Additionally, users have the option to select a specific session from a dropdown menu for more granular insights.
Overview for All Sessions:
- Total Sessions: This represents the overall count of sessions that were conducted throughout the event.
- Total Session Check-Ins: This indicates the total number of attendees/check-ins who checked into sessions during the specified date range.
- Total Session Check-Outs: This reflects the number of attendees who were checked-out of sessions during the specified date range.
- All Sessions: A comprehensive list detailing the check-ins and check-outs for each individual session.

Overview for Individual Session:
When a specific session is chosen from the dropdown menu, the dashboard displays more focused data on that session’s attendance and engagement, both for on-site and online attendees.
On Site Attendance
The On-Site Attendance section provides a comprehensive summary of the total check-ins and check-outs recorded for all sessions.
- Check-In Rate: Check-in rate is calculated by dividing the number of users who checked into the event by the number of people in the attendees group.
- Registered: The total number of attendees in the people list.
- Checked In: The number of attendees who checked in to the session.
- Checked Out: The number of attendees who checked out of the session.
Furthermore, a comprehensive list of all check-ins and check-outs for this session will be provided, detailing the following information:
- First Name and Last Name of the attendee.
- Email: The attendee's email address.
- Groups: The groups or categories the attendee belongs to (e.g., speakers, VIPs, specific attendee segments).
- Time: The exact time the attendee checked in or out of the session.

Online Attendance
The Online Attendance area shows the total number of page visits and and the total number of individual devices used to access the session details page in your Event App.
- Total Visits: The number of times the session was visited by online attendees.
- Total Unique Visitors: The number of distinct individuals who attended the session online.
- First Name and Last Name.
- Email: The attendee's email address.
- Groups: The attendee’s group affiliations or role (e.g., staff, breakout session participant, or VIP).

5. Gamification
The Analytics section of the Experience Manager provides deeper insights into your Gamification product, complementing the leaderboards available in your Event App and Live Display that showcase top participants.

To obtain a detailed report, click on the Generate Excel Report option at the top right corner of the page, then select Download. The Excel file includes three tabs:
-
Game State: An overview of the game, including the total number of challenges, players, and completed challenges.
-
Challenges by Player: A player-level breakdown showing each participant’s first name, last name, email, company, title, and the challenges they have completed.
-
Chronological: A time-based record showing when each challenge was completed, along with the challenge name and the player’s full details.


6. Banner Ads
Banners effectively highlight top sponsors and event activities while directing attendees to relevant content. To assess banner performance, visit the Banners tab in the Analytics area of the Experience Manager.
Each banner's analytics includes:
- Ad: This refers to the title of the Banner Ad as specified in the Experience Manager.
- Links To: This section indicates if the Banner Ad is associated with a Company Profile.
- Impressions: This represents the total number of times the Banner Ad was viewed within the Event App.
- Total Clicks: This denotes the overall number of clicks made by users interacting with the Banner Ad.
- Conversion Rate: This metric is calculated by dividing the number of clicks by the total number of Impressions for each Banner Ad, providing insights into its effectiveness.

7. Networking
Within the Analytics area of the Experience Manager, you will find reporting on the activity of your Appointments, Chats and Group Discussions features that will help you to gain insights into how much networking took place at your event.

Appointment Analytics
In this section, you can track the number of appointment booking requests that have been sent and accepted during the specified date range. The Appointment feature allows attendees to schedule one-on-one meetings with one another directly through the app, facilitating seamless networking opportunities.
Chat Analytics
In the Chat section of your Networking Analytics, you will gain insights into user adoption rates, the total number of messages exchanged, and a list of top participants. While the specific content of these messages remains confidential to protect user privacy, this data will provide you with a clearer understanding of the level of networking activity that occurred through the Event App.
- Adoption Rate: The Adoption Rate is determined by dividing the number of individuals who have sent or received chat messages by the total number of people in the people list.
- People: This metric indicates the total number of individuals included in the Experience Manager's people library.
- Messages Sent: This figure represents the cumulative total of messages exchanged across all chats.
- Participants: Participants are defined as individuals who have either sent or received at least one message.
- Average Messages Sent: This metric reflects the average number of messages sent by each participant.
- Top Participants: This section lists the most active users in the chat, detailing the number of messages they have sent, received, and read.

Group Discussion Analytics
Group Discussions serve as a valuable tool for connecting individuals with shared interests, thereby enhancing networking opportunities at your event. In the Networking Analytics section, you can access detailed insights on the following data:
- Adoption Rate: The Adoption Rate is determined by dividing the number of individuals who actively participated in a group discussion channel by the total number of people in that group.
- Channels: This represents the total count of channels created within the Group Discussion feature.
- Participants: This indicates the total number of individuals who have actively engaged with the Group Discussion feature.
- Messages Sent: This reflects the total number of messages exchanged across all channels.
- Top Channels: A listing of the top 10 channels, including the number of active participants and the total messages sent within each channel.

8. Live Stream Analytics
To effectively manage live streaming for your event, it's crucial to monitor viewer hours to stay within your purchased limits. Live Stream video analytics include Streaming Hours, which measure how long video content has been streamed, and Live Viewer Hours, which indicate how long attendees watched the live stream. Purchased Streaming and Viewer hours are allocated at the organization level, allowing for shared access across all events within your organization.

Viewing Live Stream Analytics for your Event
In the Analytics section of the Experience Manager, you will find the Live Stream option, which provides insights into the total viewing time for live streams during your event.
To gain a clearer understanding of how your viewer hours are being utilized, you can refer to the Live Stream (RTMP) Usage chart. This chart displays your viewing trends and offers a detailed breakdown of the streaming and viewing times for each session.
Live stream analytics data is delayed by 12 hours and does not reflect the real time view hours or stream hours applicable to your event.
Viewer hours
Viewing time reflects the duration attendees spend watching the live stream, based on the number of devices connected. While View Hours provide an estimate of total virtual attendance, they may be inflated if attendees connect from multiple devices.
Will I be cut off from live streaming once I surpass my limit of Streaming or View Hours?
Live Stream Analytics and email notifications help you monitor your usage of Streaming and View Hours. Exceeding your limits will not disrupt your live stream; however, any additional hours used will be invoiced to your account.
9. Video On Demand Analytics
The Video On Demand Analytics section offers event organizers insights into attendee interactions with on-demand video content, including total views, unique viewers, and watch time.
- Total Views: The overall number of times all videos have been viewed by attendees. This metric helps assess the popularity of video content across the event platform.
- Total Unique Viewers: The number of distinct attendees/devices who have watched any video. This shows how many individual users engaged with the video content, providing insights into reach and audience engagement.
- Total Video Consumed: The total duration of all videos watched by attendees, measured in hours. This gives organizers a clear picture of how much content attendees are consuming.

Top Videos
The Top Videos section provides a ranking of the most popular videos, determined by both the total number of views and the count of unique viewers. This section includes the following details:
- Video Title: The name of the video as uploaded in the Video library.
- Total Views: The cumulative number of times the video has been played.
- Unique Viewers: The count of distinct attendees/devices who have watched the video.
 Audience Viewership
The Audience Viewership section offers an in-depth analysis of how individual attendees engaged with video content. This includes:
- Logged In Viewers: The names of attendees who accessed videos while signed into the platform.
- Email: The email addresses of each viewer, enabling organizers to reach out for follow-up if needed.
- Video Title: The title of the specific video that the attendee viewed.
- Watch Duration: The total time (measured in minutes) that each attendee spent watching the video.

Event organizers have the option to filter video viewership data by specific date ranges or select one or more videos from a dropdown menu. This capability enables a targeted analysis of viewing trends over time.